Gann Vault
Dynamic Gann Levels
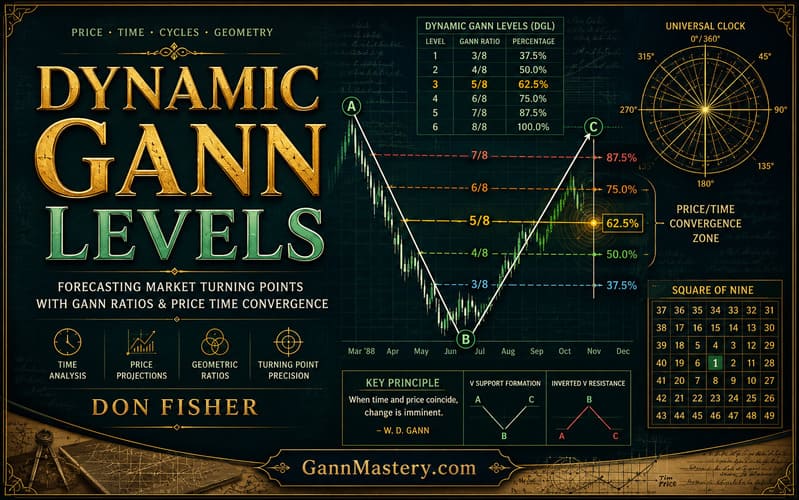
Dynamic Gann Levels by Don Fisher presents a structured and mathematically driven methodology for identifying market turning points using the principles of W.D. Gann and Elliott Wave theory. The work focuses on the relationship between price, time, and proportional movement, arguing that market behavior is not random but follows recurring geometric and cyclical patterns derived from previous price action.
The core of the methodology is the construction of Dynamic Gann Levels (DGLs), which are generated from three consecutive market turning points forming either a V-shaped support structure or an inverted V resistance structure. Fisher explains how these formations are analyzed across multiple degrees of trend — short-term, medium-term, and long-term — reflecting Elliott’s concept of waves within waves.
The system applies Gann’s proportional ratios — particularly 37.5%, 50%, 62.5%, 75%, and 87.5% — to measure the movement between swing points in both price and time dimensions. These ratios are converted into precise coordinate calculations that project future support and resistance dynamically rather than statically.
Advanced Books and Courses on Time & Cycle Studies


A major emphasis is placed on “price/time convergence,” where multiple projected levels cluster together. Fisher demonstrates that these convergence zones frequently correspond with major market reversals and provide low-risk trade opportunities with clearly defined stop-loss placement. Level 3, representing the 62.5% relationship, is identified as the most critical turning-point level throughout the study.
The article also integrates practical trade management concepts, including trailing stops, reversal confirmations, multi-timeframe analysis, and probability-based trading discipline. Real examples using IBM stock and Deutsche Mark futures illustrate how Dynamic Gann Levels can forecast future market highs and lows with remarkable precision while adapting automatically to volatility and market structure.