Articles
A Gann Study of A Bull Move In Wheat By Richard Diaz
Wheat futures rallied recently more than $1.88 to trade at the highest level since 1980. The move carried from the July 8, 1991, low made at 272-1/2 in the December 1991 contract to the high made at 463- 1/4 on February 10,1992, in the March 1992 contract. Several Gann factors were exceptionally helpful in calling the top price as well as its timing.

FIGURE 1: WHEAT APRIL 1991-FEBRUARY 1992 CONTINUOUS CHART. This daily continuation chart plots the relevant futures contract and adjusts the price scale when the switch is made to the next relevant contract.
Figure 1 is a daily continuation chart that plots the relevant futures contract and adjusts the price scale when the switch is made from one contract to the next. Thus, on June 14, 1991, July wheat went out at 293 and the December contract settled at 310-1/4 on that day (I skip the September contract because I prefer to work on a longer run of contract) . From that point on through November 15,1991, the chart plots the price activity of the December 1991 contract. Adjusting the price scale allows a realistic appraisal of the continuous price movement.

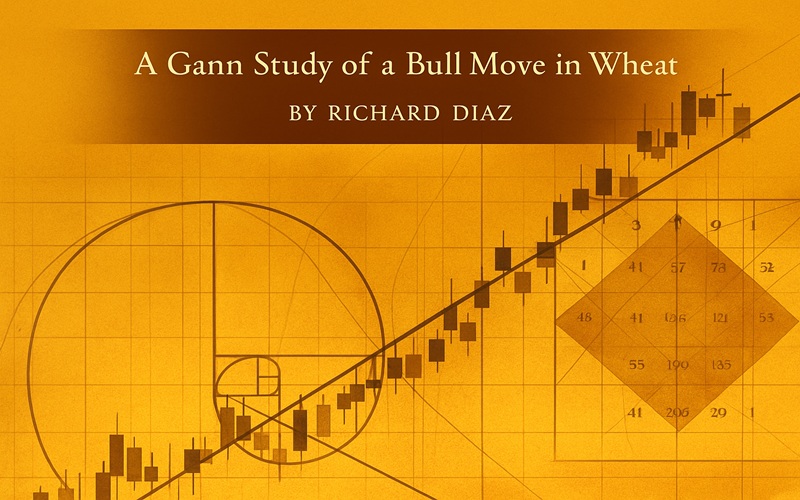
FIGURE 2: GANN’S SQUARE OF NINE. Important turning points in the wheat market for price and time fell on the 45 and 225-degree line.
Figure 2 is Gann’s square of nine and is very useful in determining future time/price intervals that are significant to a given key high or low price. The low made on July 8, 1991, was 272-1/2, and this number can be found along the 225-degree line in the eighth cycle. The strongest points for resistance in both price and time are at the opposition points (180 degrees apart) and at the full-cycle points (a complete move of 360 degrees). Starting at 31, note the numbers along the 45-degree line (opposition) and along the 225-degree line, that is, 31, 43, 57, 73, 91, and so on. Figure 3 indicates where these numbers, taken as market days from the low of July 8, 1991, occurred.

FIGURE 3: WHEAT APRIL 1991-FEBRUARY 1992 CONTINUOUS CHART. From the square of nine chart, the day counts are plotted. Notice that the countertrend moves ended 31, 57 and 91 days from the beginning of the bull market.
The sharp break that occurred on August 19, 1991, was the result of the attempted coup in the former USSR. The low was made at 291-1/2 on the following day, which was 31 days from the start. The number 31 is on the 45-degree line in the square-of-nine chart. The next number along this line is 57, and 57 days from July 8, 1991, occurs on September 27, 1991. December wheat made a low on September 28 and two days later regained the 45-degree line up from the low. This line was not broken on a closing basis until the December wheat contract fell to 344-1/ 2 on November 12, 1991. On that day, the market was 91 days from July 8,1991; 91 follows 57 along the 45-degree line in the square of nine chart. Note that the low made that day was only 1-1/2 cents from 343, which was one full cycle up from the 272-1/2 low.
Figure 3 highlights two dates — the starting point of the move on July 8, 1991, and the first significant high of October 25, 1991. This move carried 96-3/4 cents and unfolded in 79 market days. On the square of nine chart, you will find 96 along the 90-degree line; the following cycles of 90 degrees are at 411-1/2 (272-1/2 plus 139) and 462-1/2 (272-1/2 plus 190). We’ll see shortly why 79 market days was an important time interval.
🔍 Master Gann’s Tools – Recommended Ebooks


SWING YOUR PARTNER
I have found it very useful to measure the vertical span of what I call the counterswing move — namely, the last swing into the high or low from which an extended move begins.
Of course, one has to allow some time to ascertain that an important swing is in fact under way. Very often, the main swing conforming to the intermediate- or long-term trend will make important highs or lows at time and price intervals that are mathematically derived from the “counterswing move.”

FIGURE 4: SQUARE OF 49. The last decline by December wheat was for 49 cents and ended on July 8, 1991. Squaring 49 cents by 49 days produces the square-of-49 chart. Notice that the wheat market peaked in the fourth square up and the fourth square over.
Allowing for the scale adjustment, this counterswing on the daily wheat chart consists of 49 boxes — in this case, 49 cents into the 272- 1/2 low. To square this range thus takes 49 market days by 49 cents starting from the low price. Figure 4 has this square of 49 overlaid on the daily chart. Note how the entire move followed the 45-degree line up from the low and how the top was made against the 45-degree line in the fourth square up and the fourth square over in time.

FIGURE 5: DOUBLE SQUARE. Doubling the square of 49 and taking the square root forms a double square with sides 69.25 cents by 69.25 days. The bull move ended with a price gain that was 2.75 times 69.25 cents.
Using the golden mean in Fibonacci theory, 1.618 times 49 equals 79 days. The move from July 8, 1991, to the first significant high made on October 25,1991, covered 79 market days and, thus, was at the Fibonacci point in time in the second square. The area formed by the square of 49 is 2,401. If we double the area of that square to get the square with twice the time/price area, we get a square with sides of 69.29. This means a square of 69-1/4 cents by 69-1/4 days. The top made at 463-1/ 4 occurred at the 2-3/4 point of this double square (2.75 times 69.29 = 190.56 plus 272-1/2 = 463) in price and at the 2.25 point of the square in time (2.25 times 69.29 = 155.9).
These measurements were derived from the square of the “counterswing move” into the low of July 8,1991. They helped to reinforce the time/price points indicated by the square of nine chart. In all, properly utilized, Gann analysis appears to be useful for calling the timing and price activity of wheat futures.
Richard Diaz is a commodities analyst and the originator of Gann Scan.