W.D. Gann's Techniques
Targeting Price And Time With Gann By Cornelius Luca
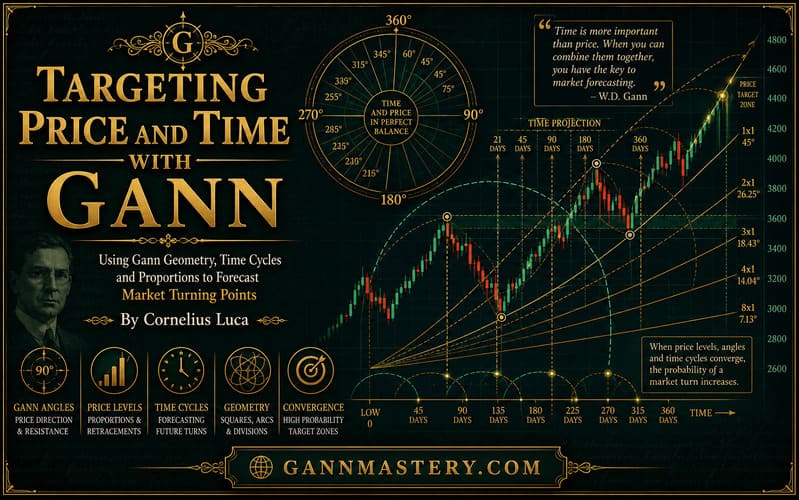
Want to improve your trading performance? Here’s a look at some of W.D. Gann’s methods. Stocks and commodities trader William Delbert Gann (1878–1955) made fortunes before, during, and after the stock market crash of 1929. His success was facilitated by set complex mathematical methods that combined time and price analysis. While his fans and retracement ratios have gained increasing access and understanding, some of Gann’s methods are not as popular or clear, though they still are worth examining. Let us look at some of these methods that can enhance your trading performance.
SQUARING OF PRICE AND TIME
The squaring of price and time refers to Gann’s technique that translates a significant high or low price for a currency pair into time units, anywhere from days to years. It then adds these time periods to the day the significant price was reached. When the calculated time target is reached, time and price are squared, and the currency should reverse.
An example is seen in Figure 1 where the euro/dollar peaked at 1.3666 on December 30, 2004, which can be rounded down to 136. If you count 136 days from that peak, you will end up on July 8, 2005. The lowest low for that leg of the downtrend occurred on July 5 (1.1870), and a secondary low was formed on July 8 (1.1876), which is close.

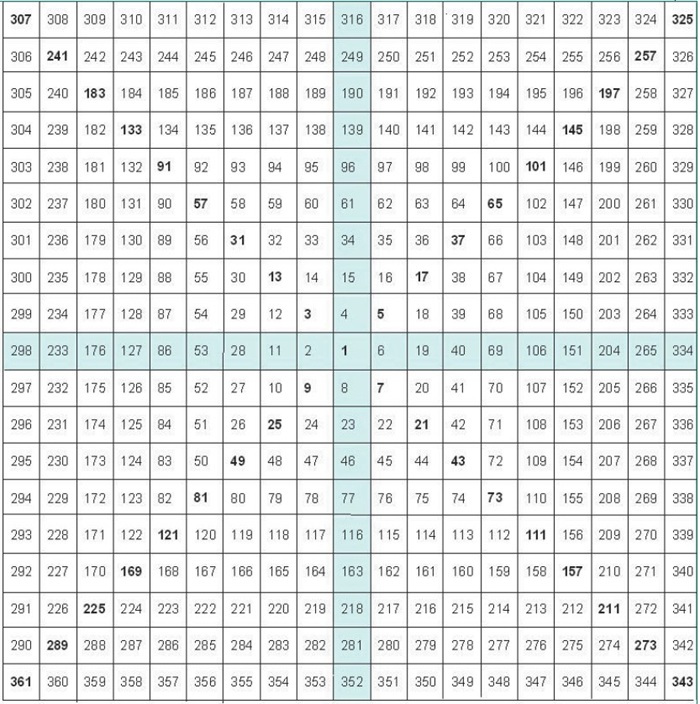
SQUARE OF NINE
Gann did not invent the square of nine, but he took this ancient method a step farther to calculate support and resistance levels in terms of both price and time. The square is formed by a clockwise spiral that starts with the number 1. This number becomes the center of a square (Figure 2). When you start from the lower left-hand corner of the grid, you will see that the odd numbers 3, 5, 7, 9, and 11 provide their squares: 9, 25, 49, 81, and 121. Conversely, the even squares of 4, 6, 8, and 10 go from the center up to the top right-hand corner: 16, 36, 64, and 100.
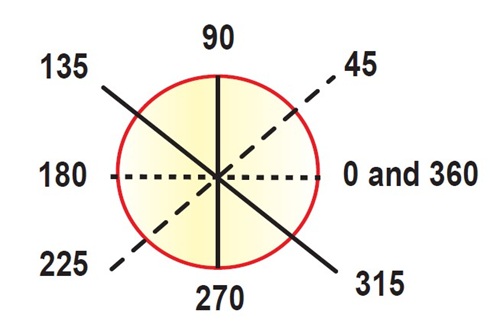
GANN GEOMETRIC FORMS
Gann employed other geometrical forms as well, including circles. A circle has 360 degrees, and this number, along with fractions of it, is omnipresent in Gann’s work. In order to obtain his time objectives, Gann extrapolated 30, 90, 120, 180, and 360 days from significant chart points. These forward periods are potential reversal dates. The secondary reversal dates are 45, 135, 225, and 315. The diagram in Figure 3 shows this application.
Going back to the square of nine, you can see why the 90-, 180-, and 270-degree angles come into play. This method also suggests that the significant support and resistance of a currency will generally be found in the consecutive numbers in a row or on one of the diagonals. The distance from 16 (the square of four) to 25 (the square of five) is 180 degrees around the chart; this is why Gann called for trend changes at 180 degrees.
If you begin from a significant low, move clockwise by 90 degrees, 180 degrees, 270 degrees, and 360 degrees. Conversely, if you start from a significant peak, move counterclockwise by 90 degrees, 180 degrees, 270 degrees, and 360 degrees. As an example, the record low in dollar/yen was approximately 80.00 (April 1995). You can find this number in the lower left-hand corner of the square in Figure 2. The three numbers below it are 120, 119, and 118.
You will find that there were several weekly peaks in February, March, April, and July 2003 around the 120 handle. The lowest levels after the uptrend that followed the record low at around 80.00 were just below 102.00 in November 2004 and January 2005. You will find 102 in the upper right-hand corner, which is on the diagonal from 80. The dollar/yen has reached higher highs than 120 since bottoming at 80.00. The highest highs were registered at 146.78 in June 1998 and 147.62 in August 1998. You will find the 146 handle on the same diagonal where you found 102.
Advanced Books and Courses on Geometry & Charting Methods


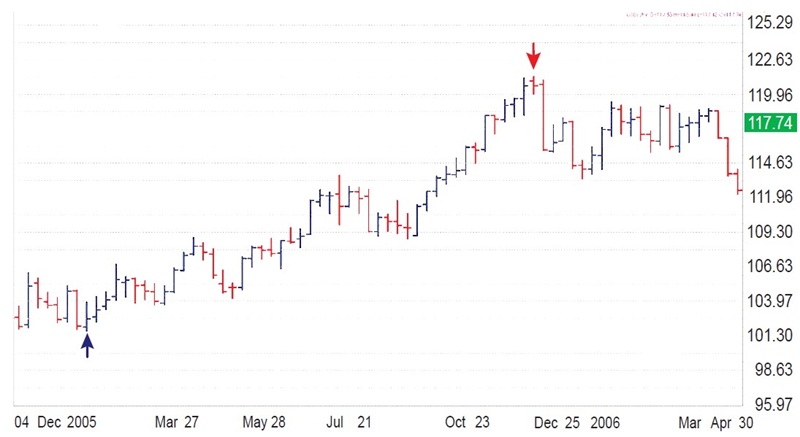
If you are seeking to target possible times of reversals, remember that W.D. Gann attached significance to the solar start of the year on March 21, which is the spring equinox. Therefore, a 180-degree move from there would take you to the autumn equinox around September 21–23, and 90 degrees would take you to the summer solstice around June 22. Of course, the winter solstice occurs around December 21–22, which is 270 degrees. Where is the date of the significant high or low price relative to the spring equinox? If you count days, do not forget to use the adjusted standard numbers of 90, 180, and so on, by multiplying them by 1.01389. You will then get 91.25, 182.5, and so forth. If using weeks, try the 45 and 135 numbers as well. For instance, dollar/yen formed a significant low on the week of January 17, 2005. The 45-week target for a possible top for the uptrend from January 17 was the week of November 28. As you can see from Figure 4, that was incorrect. It took a few days longer, but then the dollar/yen made a collapsing decline. Overall, that was a powerful warning signal.
When combining time and price, you should try this method as well: Identify the date of the significant high or low price and locate it on the square of nine. Chart the standard angles from that cell but make sure they intersect the center cell (1). Prices that fall along your trajectories may be objectives for possible lows or highs.
NATURAL SQUARES
Gann suggested that natural squares might be used for targeting support and resistance levels, length of moves and time targets. When seeking price objectives, natural squares may provide good targets. In Figure 4, the high price is 121.40. To simplify, let us say that this is 121 and this is the square of 11.
If looking for a possible target for the length of the rally or decline, consider adding the natural squares from the start of the move. For example, a high price for the euro/dollar chart was 1.2978. Once the down move began, you should have had a series of price objectives for the length of that decline. In this case, the squares of 21 (441) and of 22 (484) worked well. If you subtract 441 pips from the 1.2978 high, you obtain 1.2537, which is very close to the initial low of 1.2531. If you apply this method again and subtract 484 pips from 1.2978, you get 1.2494, again very close to the real low of 1.2479. Finally, target the time for possible peaks and bottoms by extrapolating natural square periods from significant lows and highs.
SQUARE OF 144
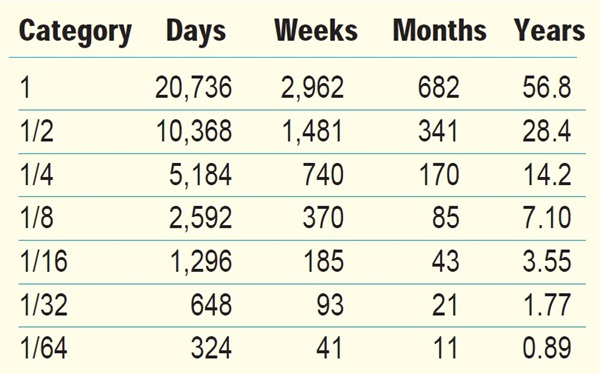
The square of 144 (a Fibonacci number) consists of an area that is 144 units high and 144 units wide. It is designed to provide areas of price support and resistance. This method tends to work better on long-term charts. In terms of time, the square of 144 can be used as follows:
144 x 144 = 20,736
Then divide 20,736 in days, weeks, months and years to forecast possible turns in trend (Figure 5).
- Cornelius Luca is an author and analyst for Global Forex Trading, and provides daily, weekly and monthly commentary on the major foreign exchange markets.